The Situation
The scenario models a 34-year-old software engineer with £83,000 a year of household income. The main wealth vehicles are a £94,000 Stocks & Shares ISA and a £38,000 workplace pension, alongside £32,000 of cash and a £210,000 flat — £374,000 of assets in total.
The objective: retire at 50 and stay funded to age 90. A simple spreadsheet with a single average return cannot say how likely that is — Monte Carlo can.

Scenario dashboard — projection hero with KPI cards
What Wealth365 Showed
Across the 56-year projection the pension peaks at £1.21m and the Stocks & Shares ISA closes at £1.98m, with net worth reaching £6.65m by the final year.
The projection separates the ISA (accessible at 50) from the pension (accessible at 57), revealing a critical 7-year bridge gap to plan around.
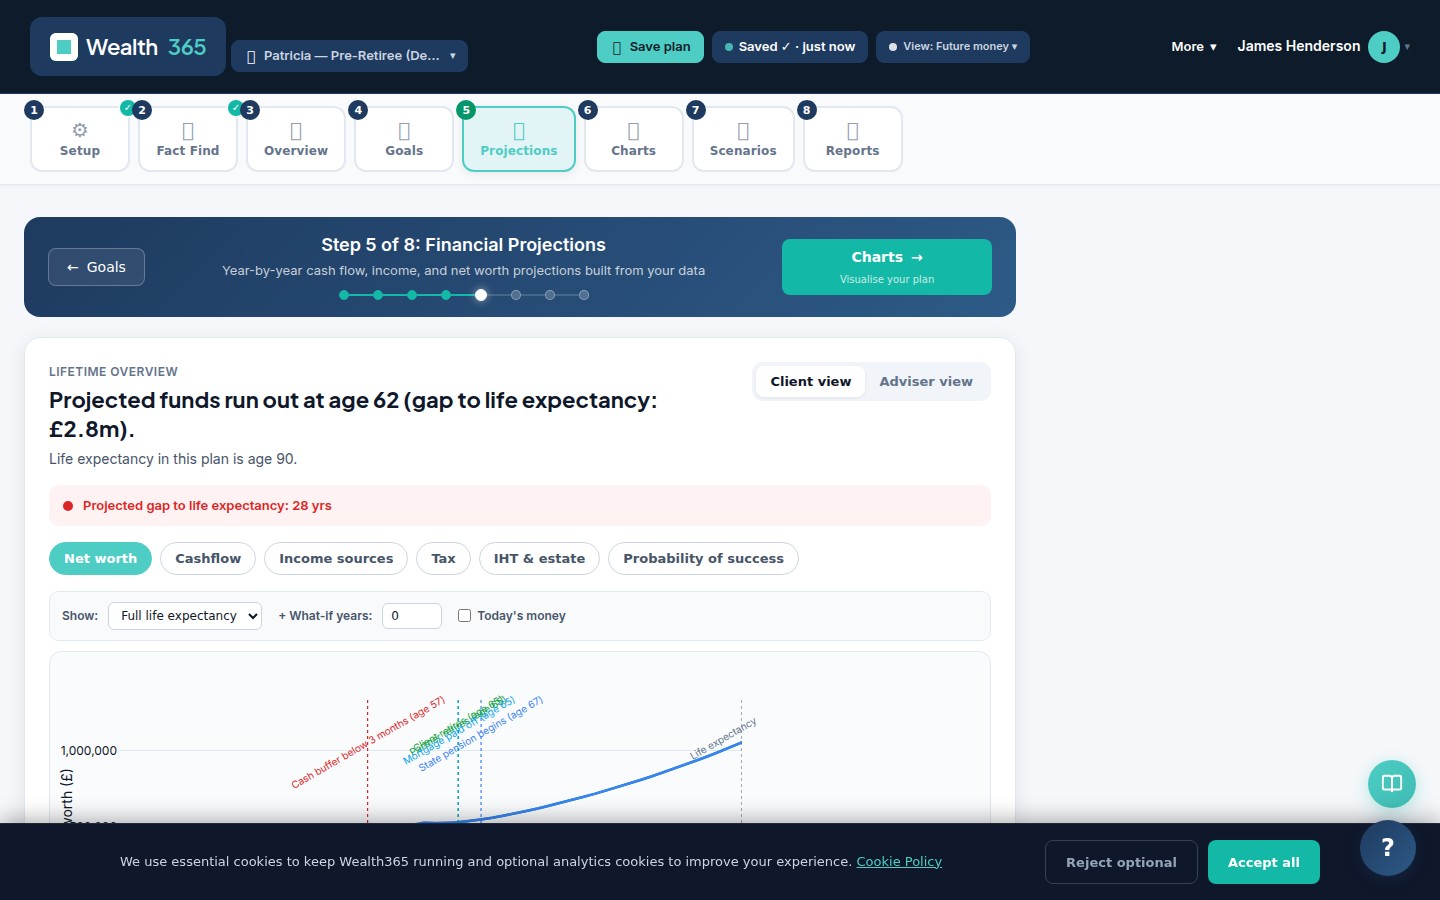
Year-by-year projection with income, expenses and net worth
The Feature That Changed Things
The Monte Carlo fan chart shows five percentile bands — 10th, 25th, 50th, 75th and 90th — as coloured areas on the net worth projection. The range of outcomes is visible at a glance, not just a single optimistic line.
The Scenario Builder tests changes side-by-side — working a little longer, trimming spending, or raising contributions — and shows how each one shifts the stressed percentile outcomes.

Monte Carlo fan chart — hundreds of simulations showing probability bands
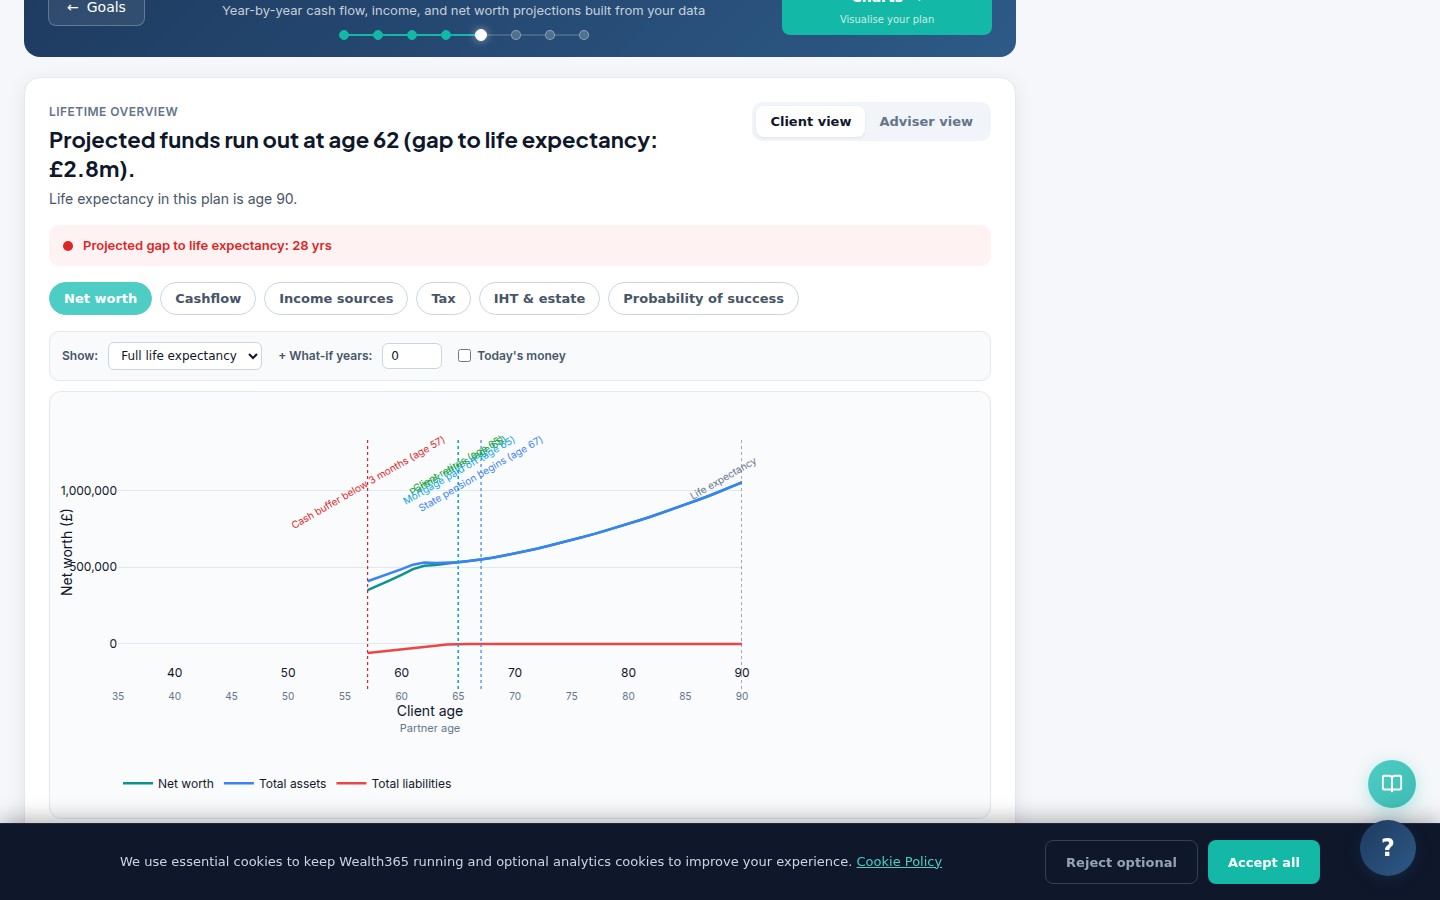
KPI summary — on-track %, projected wealth at retirement, and sustainable income
What They Did Next
The plan sets a Goal that flags if the bridge-gap projection deteriorates, and re-runs Monte Carlo after every meaningful change. The Multi-Year Financial Statements (Excel) export provides the year-by-year ledger evidence behind every assumption.
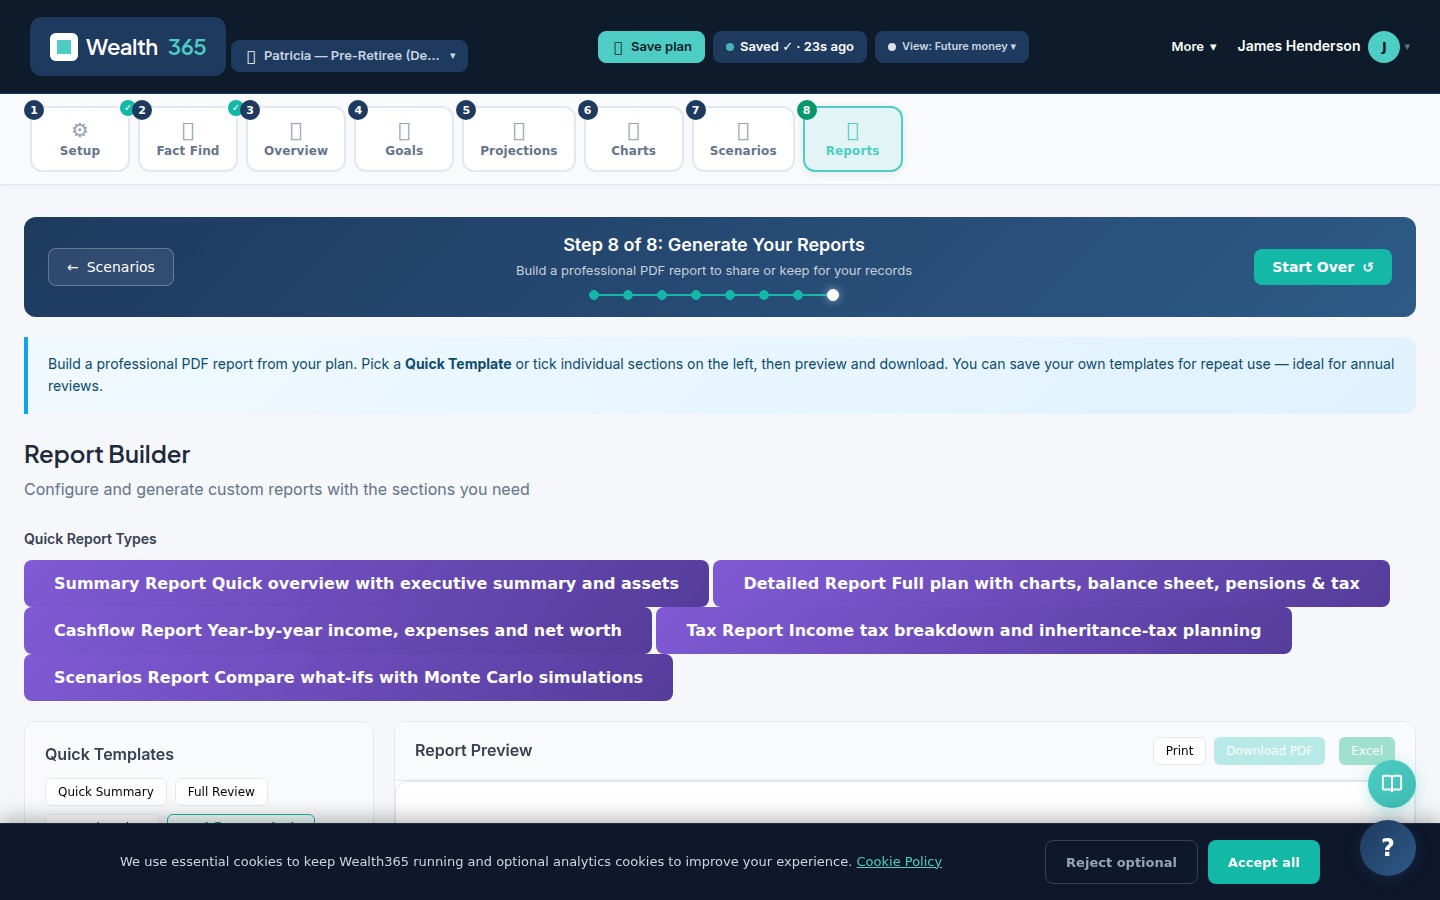
Custom-branded PDF report — ready to share or save (Multi-Year Financial Statements Excel workbook produced from the same plan)